How to check your Bandwidth Usage
Updated on Feb 9, 2018
Viewing your bandwidth usage at any time and for previous events can greatly increase your awareness of the business environment as well as show you exactly where you need to focus your future marketing campaigns and improvement of quality. As bandwidth is a precious resource, make sure to regularly check yours in order to avoid oversaturation of your hosting account's performance.
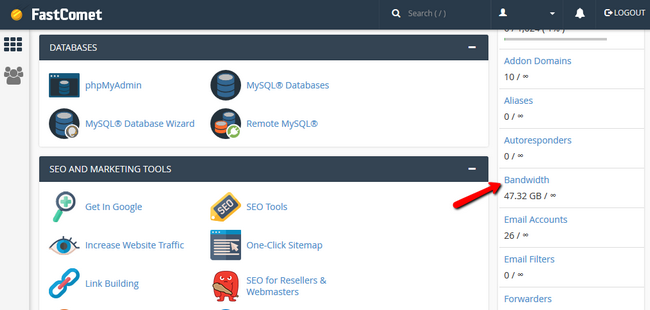
There are two main ways via which you can check on your bandwidth, both providing different statistics which will come in handy. The first way is to do it via the dedicated cPanel section. So you will have to log in your cPanel account and search for Bandwidth in the search field or simply go to the right column of statistics and scroll down till you get to the Bandwidth field.
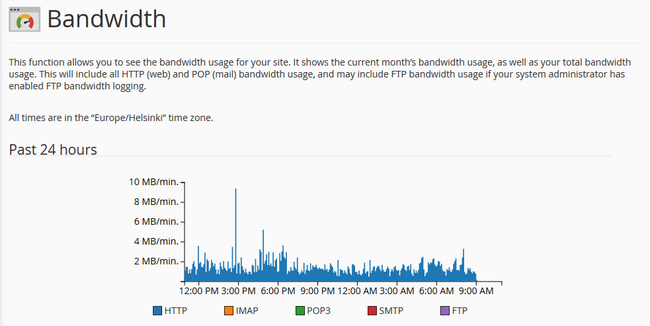
Now you will be able to see a rough chart of your bandwidth usage of the http, imap, pop3, smtp and ftp services in MB/min for the last 24 hours. By reviewing the same you will be able to determine if there was a peak of the traffic at given hour as well as the overall usage of the services during this period of time. In our example the HTTP service was heavily used so all of the bandwidth will be colored blue.
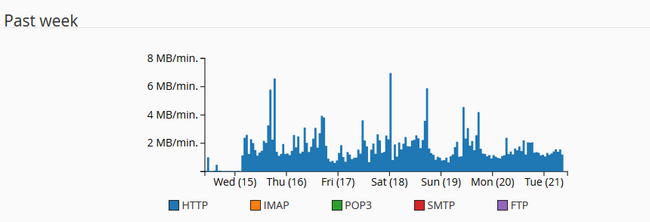
As well as one for the last 7 days.
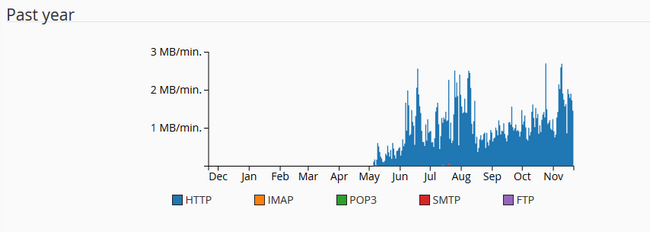
And even the last year. On this chart you can detect spikes based on monthly events as well as seasons. If you are running promotions for your products during the winter hollidays for example you will most likely see a spike in the bandwidth usage for that period.
Below them, you will be able to see a more detailed overview of your different bandwidth generators (domains, subdomains other mail/ftp services) on a monthly basis.
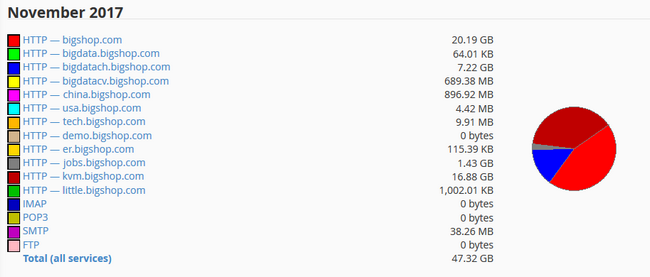
In order to get the visual representation pie chart of the previous months all you have to do is click the gray circle.
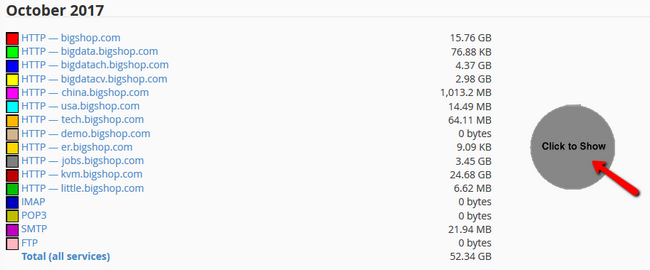
Clicking on a already loaded pie chart will give you a day by day representation of your bandwidth usage including again the service which was used.
The other way to see your bandwidth usage is to visit the Resource Monitoring System via your client area's dashboard
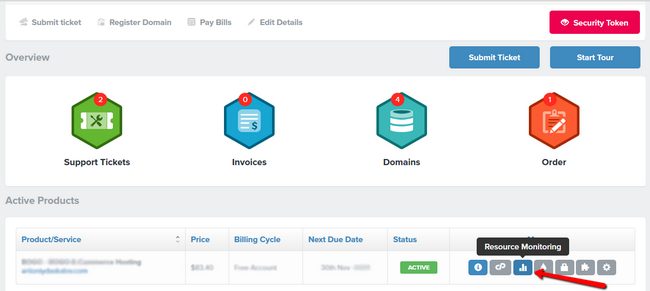
Here you can see your bandwidth usage along with other resource usage.
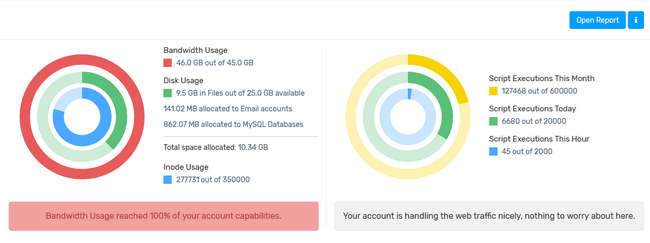
If you scroll down you will see the bandwidth usage by last 30 days, this month, last 3,6 and 12 months. If you choose one of the first two options, you will see a more detailed representation by days of your most recent bandwidth usage.
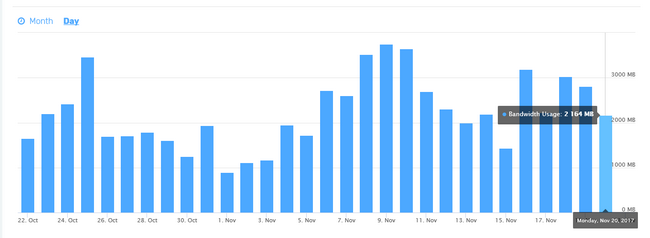
As previously mentioned this is the basic information which you can obtain regarding your bandwidth usage. For a more detailed report on your bandwidth usage, please read our other tutorial on the matter.

Optimized SSD Web Hosting
- Free Domain Transfer
- 24/7 Technical Support
- Fast SSD Storage
- Hack-free Protection
- Free Script Installation
- Free Website Transfer
- Free Cloudflare CDN
- Immediate Activation
